
Background
Within just one month of release, Capcom’s Monster Hunter Wilds surpassed 10 million copies sold worldwide. As the franchise’s first title to support cross-platform play, it reached millions of concurrent connections at launch. How did players actually feel about it? From the open betas to the official launch, player feedback voiced plenty of frustration over PC performance, content pacing, and slow updates—yet multiplayer networking received overwhelmingly positive reviews.
The multiplayer experience is fantastic—no gaming VPN needed, and cross-play is rock solid.
Curious about Monster Hunter, Capcom’s most renowned IP, I attended a session on Day 2 (June 26) of AWS Summit Japan 2025 titled 「モンスターハンターワイルズ 100 万以上のユーザー同時接続を支えたネットワークアーキテクチャ」 (Network Architecture Supporting Over 1 Million Concurrent Users in Monster Hunter Wilds). In this talk, Capcom engineer Mr. Hiroo Tsukushi shared the technical decisions, innovative ideas, and hurdles behind building their cross-platform game servers.
Core Challenge
Previous entries in the Monster Hunter series shared a major limitation: they relied on platform-specific online services (e.g., PlayStation Network, Steam), preventing players on different platforms from hunting together. Under the ambitious goals of the new title, relying on legacy platform-specific services was no longer an option. To break down these walled gardens, Capcom had to step up and engineer their own backend network services from scratch. This business decision was the foundational starting point for every complex technical choice that followed.
Architecture
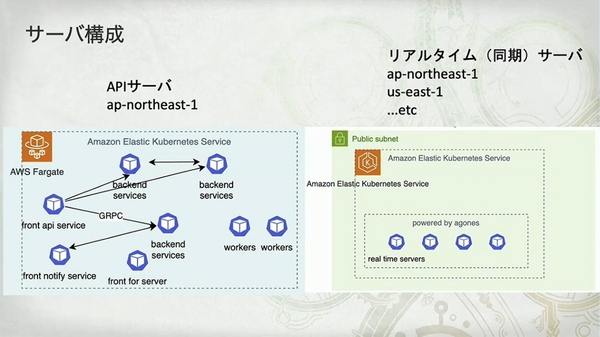
- API Servers (API サーバ): Deployed in a single region (shown in the diagram as
ap-northeast-1, Tokyo), handling core game logic and persistent data. - Real-Time Servers (リアルタイムサーバ): Globally distributed to handle low-latency player synchronization (positions, animations, and combat actions).
- Tech Stack:
Amazon EKSonAWS Fargate - Communication Protocols: Front-end services receive HTTP requests, while inter-service backend communication runs efficiently over
gRPC.
The greatest benefit of Amazon EKS on AWS Fargate is zero node management, which dramatically reduces operational overhead. But the trade-offs are equally stark: “サーバ (pod) の立ち上がりは遅い (1 分くらい)” (Pod startup is slow, taking around 1 minute) and “DaemonSet は使えない” (DaemonSets cannot be used).
A microservice architecture helped the team maintain agility across a highly complex project. But reaping the benefits of microservices required overcoming inherent design and operational complexity.
- Benefits (良かったところ):
- “Easy to isolate bugs and latency”
- “Engineers develop independently without conflicts”
- “Independent rolling updates for specific services”
- Difficulties (難しいポイント):
- “Increased CI/CD pipeline complexity”
- “Transactional integrity across distributed data stores”
From App Mesh to VPC Lattice
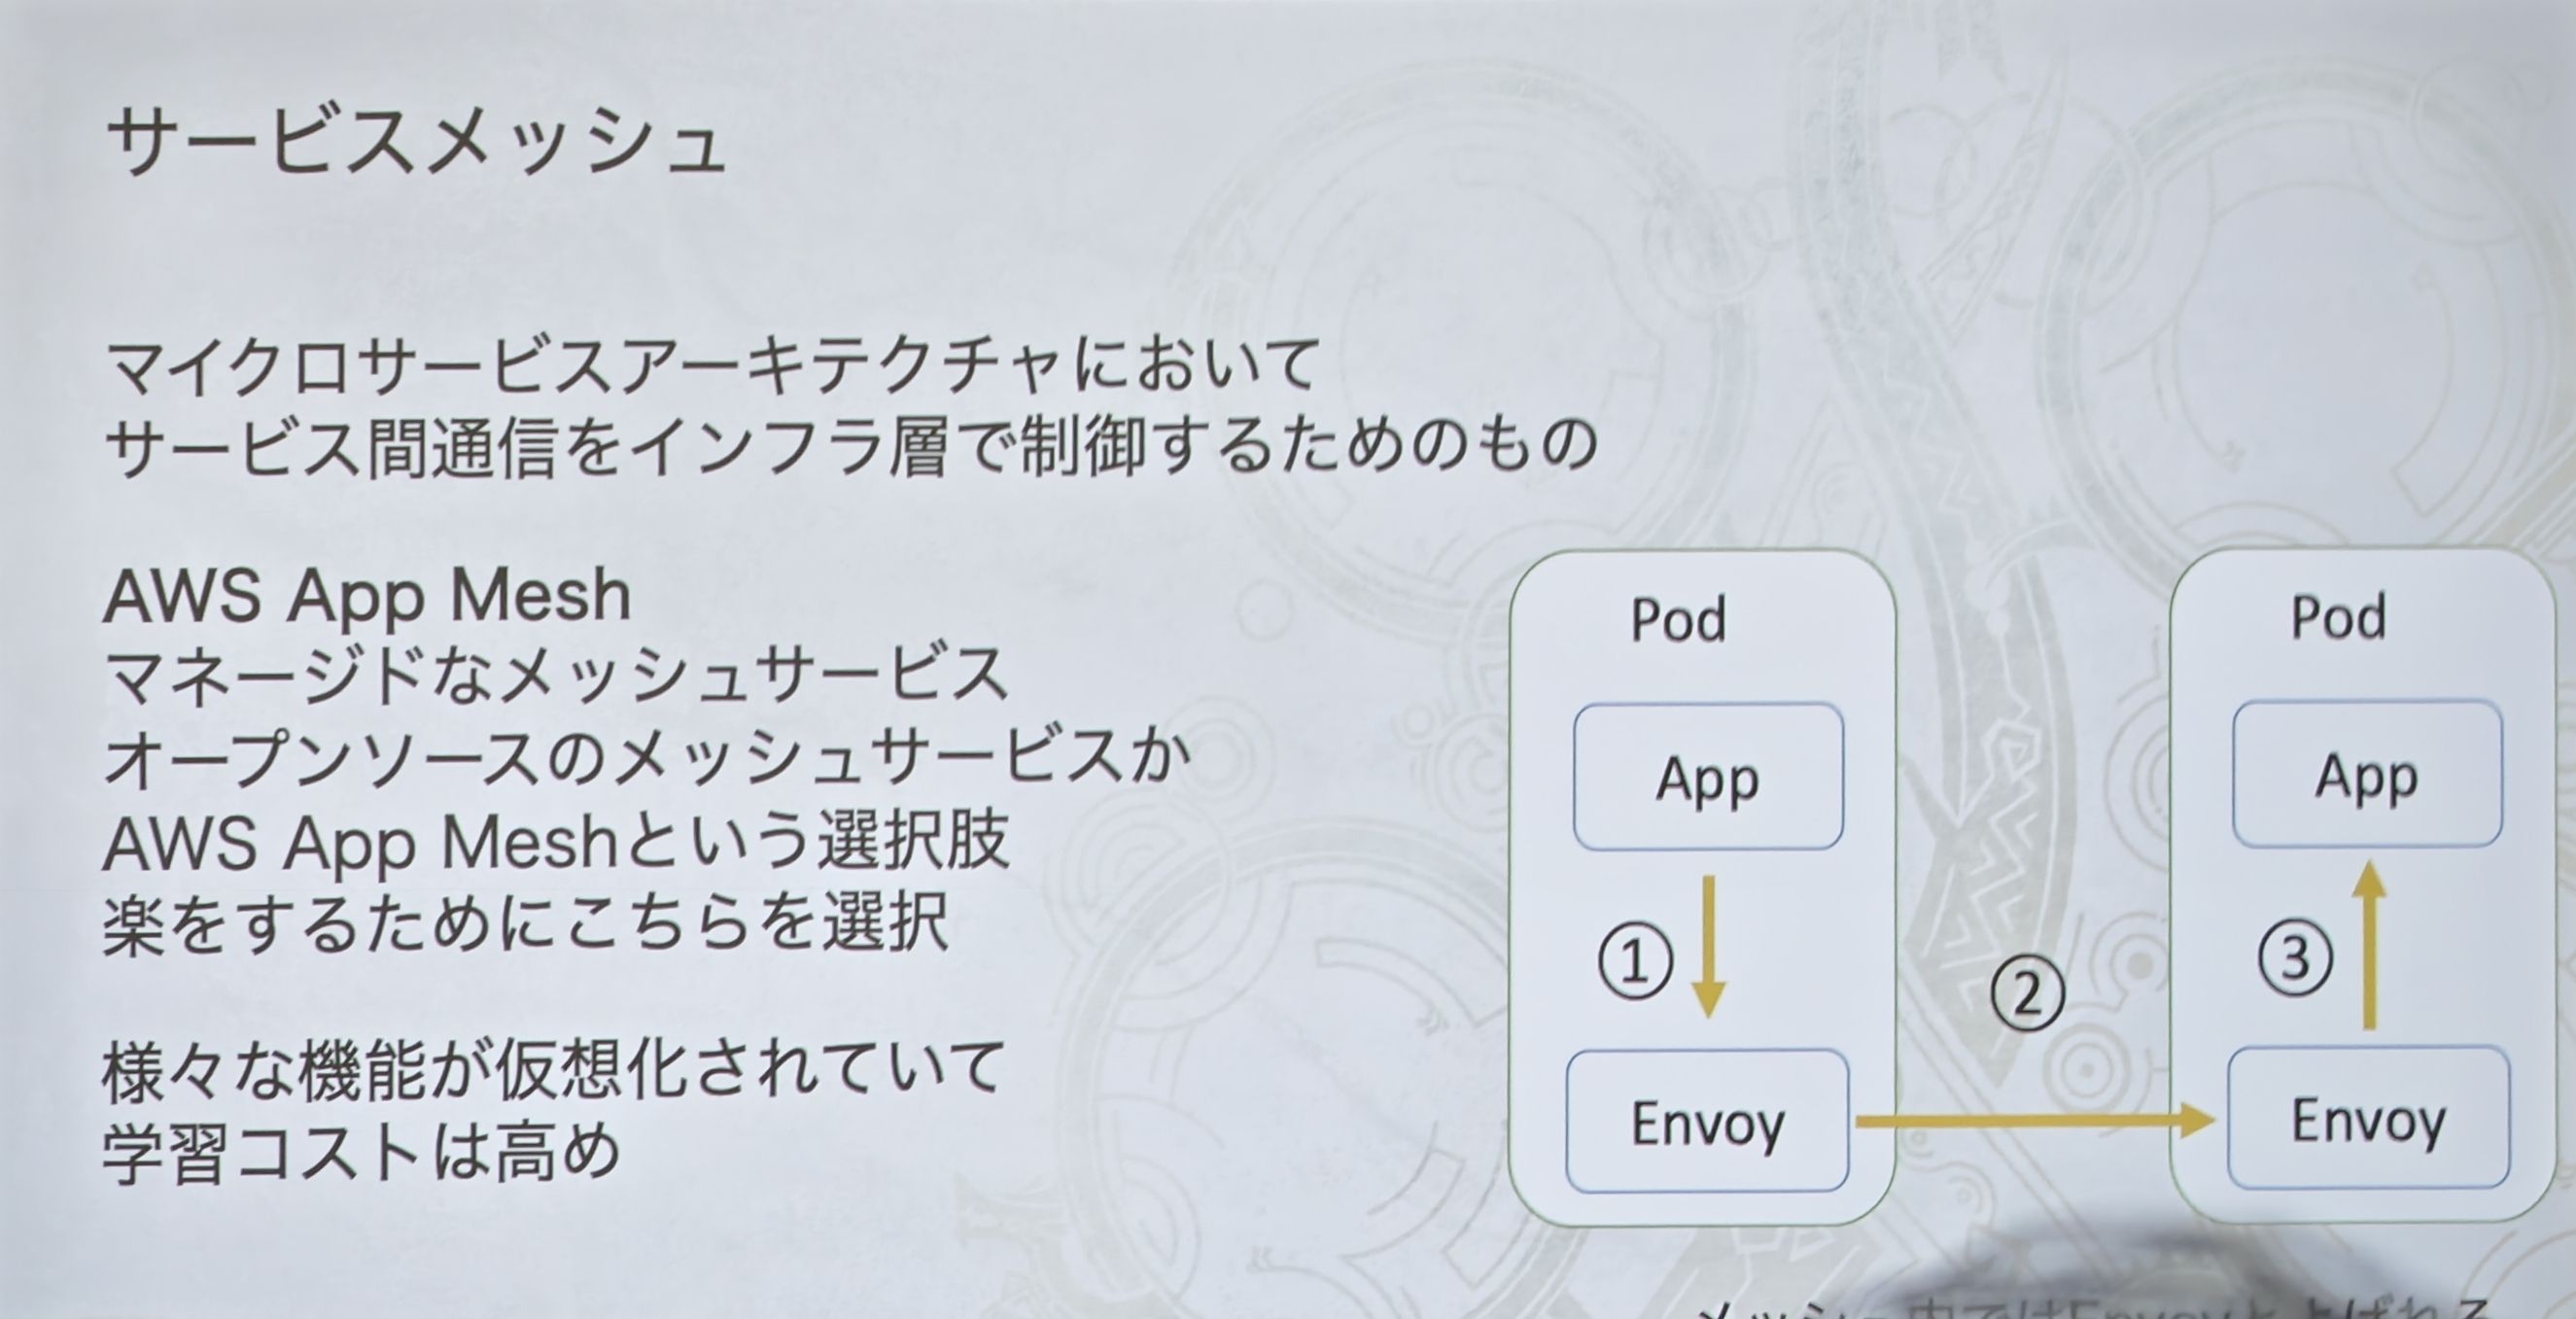
The team initially chose AWS App Mesh for convenience. The diagram above illustrates a classic service mesh sidecar pattern: application traffic is intercepted by an Envoy proxy inside the same Pod, and Envoy proxies communicate with each other.
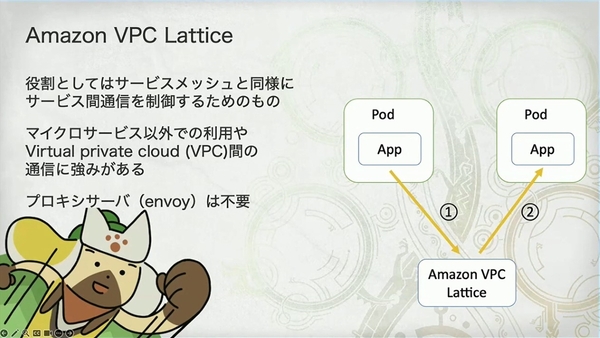
However, just prior to the Monster Hunter Wilds public beta (October 2024), AWS announced the deprecation of App Mesh (with an end-of-life date of September 30, 2026). The team had to scramble for an alternative. This slide illustrates the replacement architecture using VPC Lattice. The fundamental difference: no Envoy sidecar proxies—applications communicate directly with VPC Lattice services.
Post-Migration Architecture
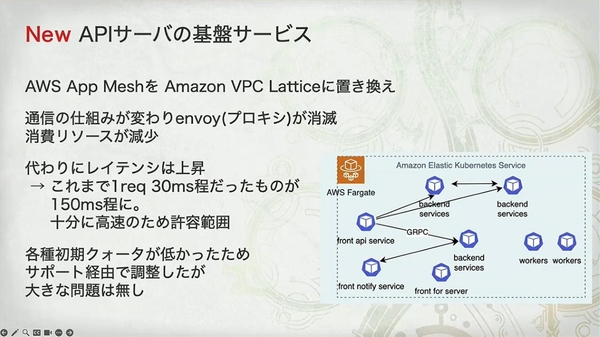
- Resource Savings: Eliminating Envoy sidecars freed up valuable Pod resources ("その分の pod のリソースが浮く").
- Increased Latency: The traffic path shifted from “App -> Local Proxy -> Target Proxy -> Target App” to “App -> VPC Lattice Service -> Target App.” While conceptually simpler, routing traffic through an external managed service increased latency from 30ms to 150ms.
Rather than taking a blind gamble before the official launch, the team scheduled a clear migration and re-testing plan between the two open betas (OBT1 and OBT2).
- Gain: Removed Envoy proxies, reducing resource consumption.
- Loss: Latency increased from 30ms to 150ms.
The conclusion—"十分に高速のため許容範囲" (Acceptable because it is still fast enough)—highlights a deliberate, well-considered engineering trade-off.
Lobby (“Gathering Hub”) Servers
Core Tasks and Challenges
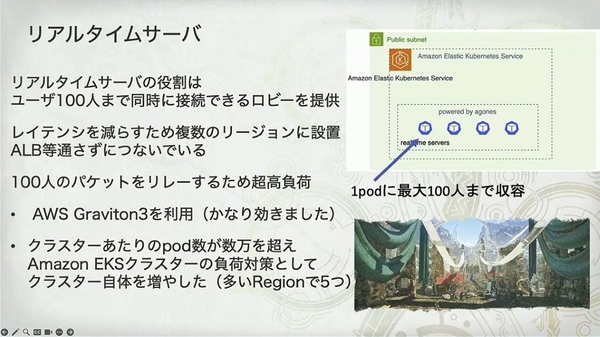
- Function: Host lobbies (“ロビー”) accommodating up to 100 concurrent players.
- Characteristics: Relaying network packets across 100 players creates a genuinely extreme workload.
- Architectural Strategy:
- Global Deployment Bypassing ALBs: For lowest possible latency, servers are deployed across multiple AWS regions with clients connecting directly, bypassing Application Load Balancers that would add latency.
- Hardware Optimization: High praise was given to AWS Graviton3 processors with the comment “かなり効きました” (Very effective), proving the performance advantage of Arm architecture in network-intensive workloads.
- Cluster Horizontal Scaling: When Pod counts in a single EKS cluster reached tens of thousands and stressed the control plane, they adopted an advanced pattern—scaling the number of clusters ("多い Region で 5 つ"), running multiple EKS clusters within a single region to distribute the load.
Custom Scaling Strategy
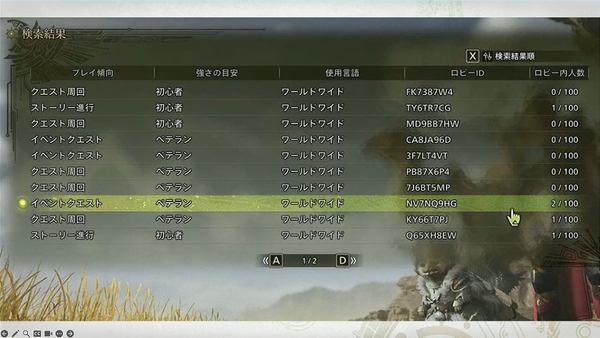
- The team rejected traditional CPU/memory-based scaling in favor of “scaling based on player count and room attributes (e.g. beginner rooms vs. veteran rooms).”
- The rationale was captured on the slide: “ユーザの動きや接続数によって消費リソースが大きく変わる” (Resource consumption fluctuates drastically based on user behavior and connection counts). For instance, a 100-player lobby engaged in intense combat consumes vastly more resources than a 100-player lobby where everyone is AFK. Monitoring CPU alone fails to reflect real demand.
- Implementation: They used Karpenter as their scaler. Karpenter’s just-in-time node provisioning fit this business-logic-driven, fine-grained scaling requirement perfectly.
An Anecdote
“We were operating on Graviton3-based C7g instances, but there were moments when we completely exhausted the instance capacity of an entire region. At one point, our production environment was running around 300,000 Pods.”
The launch load reached such an astronomical scale that it exhausted AWS’s entire regional inventory of C7g instances.
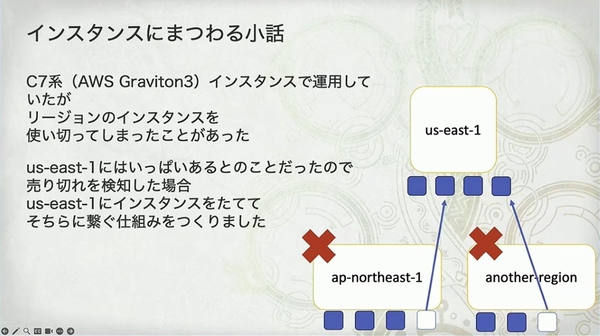
Their solution: build an automated failover mechanism. If instances in the primary preferred region showed “sold out,” the system automatically failed over to spin up servers in us-east-1 (US East, N. Virginia), where capacity is deepest. (Won’t players complain about cross-continental latency?)
Database Selection
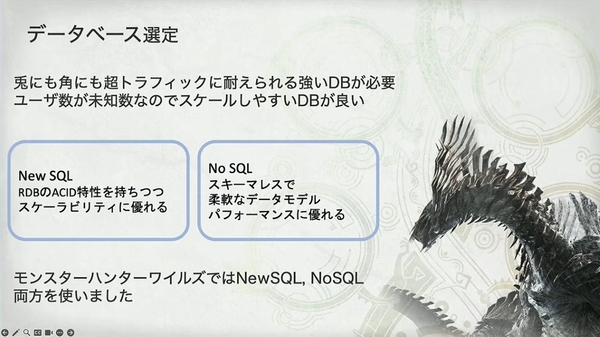
- Guiding principle: Must withstand extreme traffic and scale effortlessly under unknown player concurrency.
- The slide contrasted the two primary paradigms: NewSQL (combining ACID relational semantics with high horizontal scalability) and NoSQL (flexible schema, superior raw performance).
- The key decision appeared at the bottom right: “モンスターハンターワイルズでは NewSQL, NoSQL 両方を使いました” (In Wilds, we used both).
Primary Database: DynamoDB
- Why choose DynamoDB as the primary datastore? The rationale is classic and sound: the vast majority of data access consists of high-frequency key-value lookups scoped to a single user, such as fetching friend lists or quest history. This is DynamoDB’s wheelhouse.
- The slide cleverly set up the introduction of the second database through a Q&A (“Do we need complex search?” -> “Yes, we do!”), exposing DynamoDB’s Achilles’ heel.
The Complex Search Challenge: “SOS Flares”
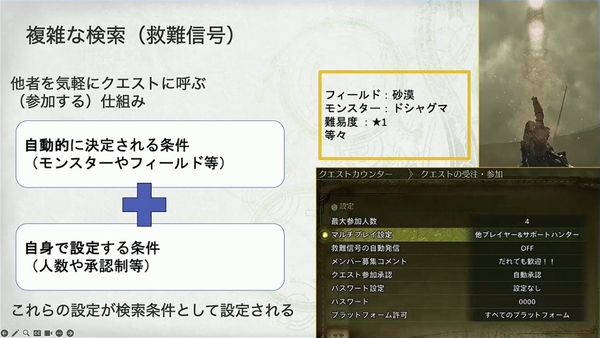
- Players need to filter and search available multiplayer sessions across multiple dimensions, such as playstyle, quest difficulty, language, and target monsters.
- The SOS Flare search imposed “かなりきついデータ条件” (Extremely demanding data criteria). Multi-criteria querying across tens of millions of active quests created by millions of concurrent players cannot be handled efficiently by a pure key-value store like DynamoDB.
This was far from a simple query:
- Combinatorial Filters: Composed of both system-determined criteria (target monster, locale) and player-configured settings (player limits, passcodes).
- Multi-Dimensional, Low-Cardinality Queries: Filtering across quest type, difficulty, and language presents low cardinality ("カーディナリティが低い"), making secondary index design in key-value stores notoriously difficult.
Why TiDB?
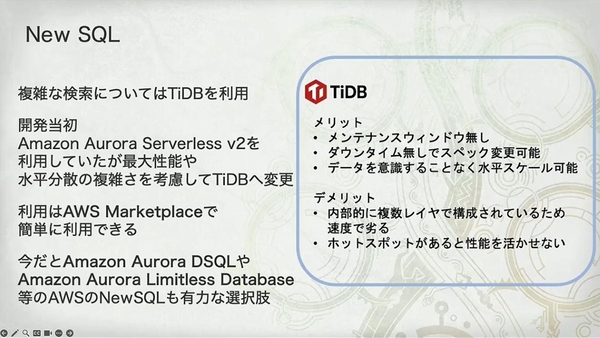
Early in development, the team evaluated Amazon Aurora Serverless v2, but pivoted to TiDB after factoring in maximum performance ceilings and application-layer horizontal sharding complexity ("水平分散の複雑さ"). They didn’t just need something that worked; they needed an engine that scaled reliably under extreme edge loads.
- Pros and Cons:
- Pros: Zero maintenance windows, zero-downtime scaling, and transparent horizontal scaling for applications—vital for a 24/7 live-service game.
- Cons: Slightly higher query latency due to multi-tiered distributed architecture; performance dips under hot spotting.
CQRS (Command Query Responsibility Segregation)
Data Flow:
- When a player triggers an SOS Flare search, the request routes to TiDB.
- TiDB’s distributed SQL engine runs multi-condition filtering against optimized index tables, returning a list of matching quest IDs.
- The application takes those IDs and performs high-throughput batch key-value lookups against Amazon DynamoDB to retrieve complete quest payloads (members, state, gear).
Core Advantages:
- Separation of Concerns: TiDB focuses exclusively on complex multi-dimensional search; DynamoDB handles high-concurrency key-value reads and writes.
- Performance Isolation: Heavy search traffic is completely decoupled from critical read/write paths, preventing mutual degradation.
- Cost and Efficiency Optimization: Storing only minimal index metadata in TiDB kept NewSQL storage footprints lean, preserving fast query execution.
DynamoDB handles 80% of standard, high-concurrency key-value lookups, maximizing raw throughput and horizontal scale.
TiDB tackles the 20% hard problem—complex multi-dimensional queries like SOS Flare matchmaking. By storing only search index columns in TiDB and resolving full payloads back in DynamoDB, they built a textbook, high-efficiency CQRS implementation.
Full-Stack Observability
Prometheus + Grafana
- Stack: The team chose Amazon Managed Service for Prometheus and Amazon Managed Grafana.
- Motivation: Pragmatism won again. Self-hosting Prometheus is “かなりのメモリ食い” (a major memory hog) and difficult to manage, while learning PromQL is “かなり大変” (quite a challenge). Adopting AWS managed services freed engineering bandwidth from managing monitoring infrastructure to focus on the game.
APM for Microservice Insights
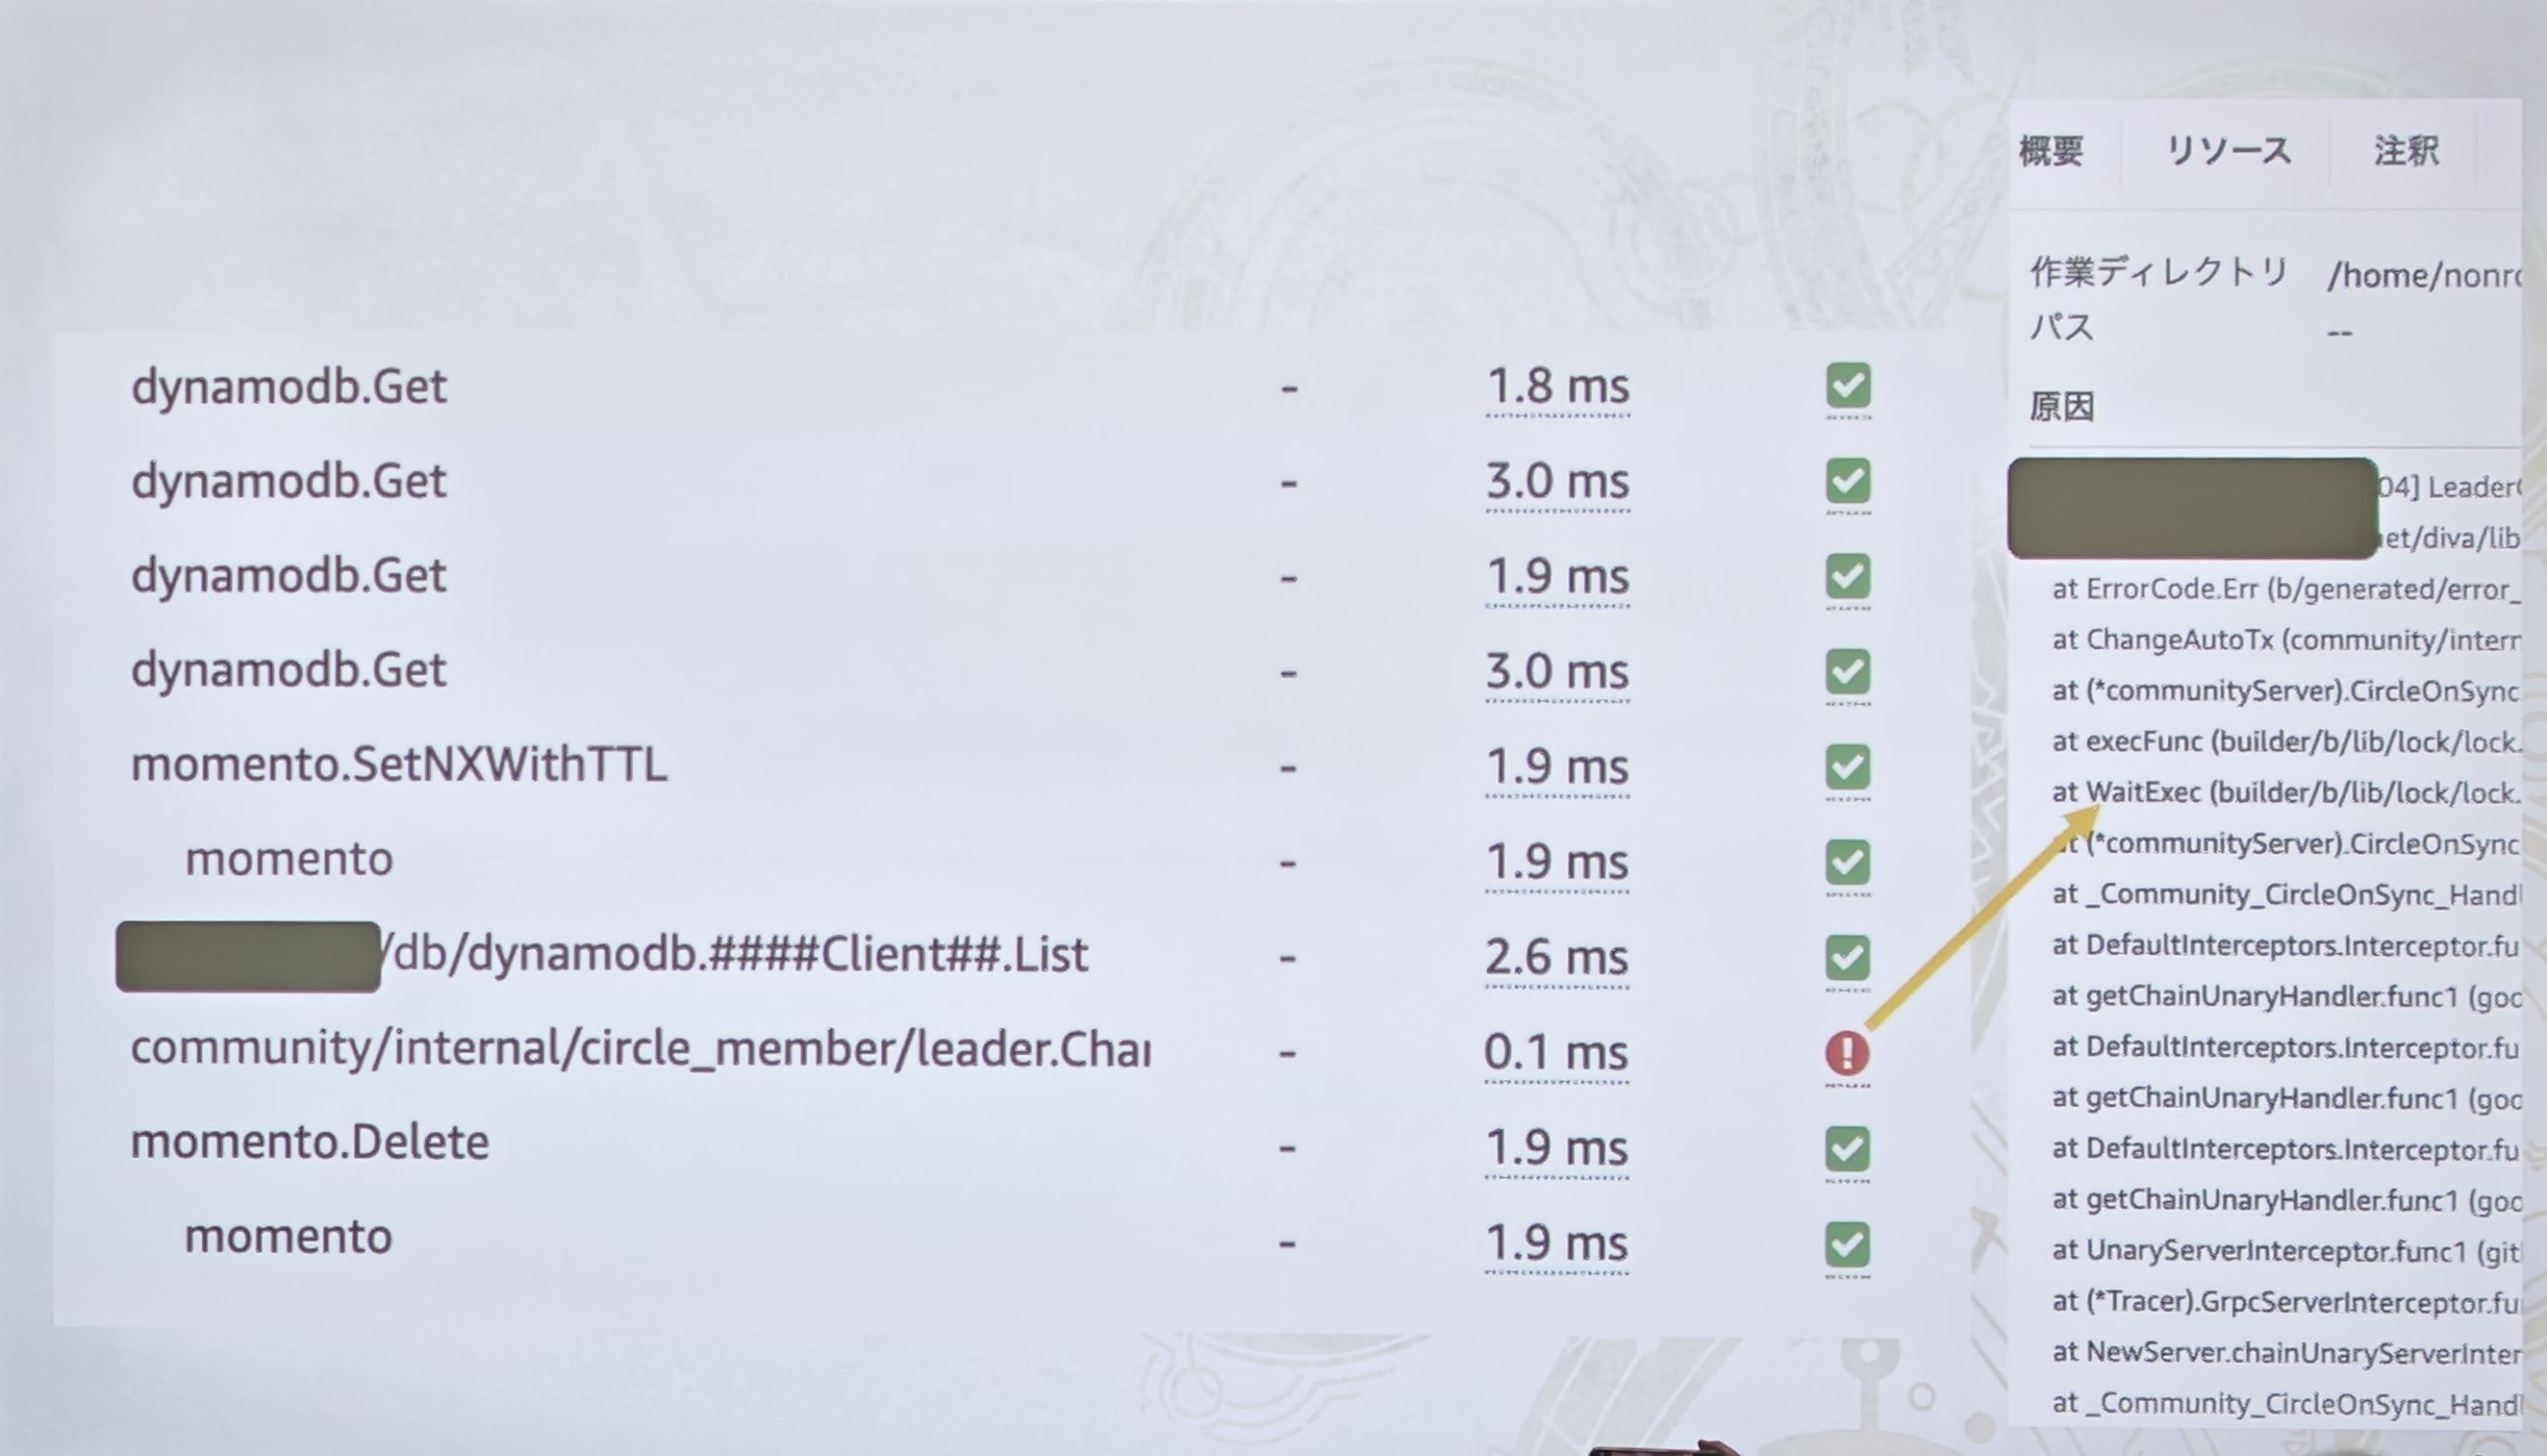
- Why APM Was Mandatory: A distributed microservice architecture requires distributed tracing.
- Tech Selection: Between self-hosting Jaeger and using AWS X-Ray, they opted for AWS X-Ray because it was “楽に構築できそうな” (seemed easy to set up).
- Value Delivered:
- The X-Ray service map turned tangled inter-service dependencies into a clean topology graph. Engineers could visually trace requests flowing from clients through backend services and measure latency at each hop.
- The detailed waterfall traces provided micro-level visibility. Engineers could inspect precise execution durations for downstream calls like
dynamodb.Getandmomento.SetNXWithTTL(revealing Momento as their distributed caching layer). When anomalies surfaced (indicated by red exclamation marks), developers could pinpoint the exact line of code and stack trace immediately.
Extreme Load Testing
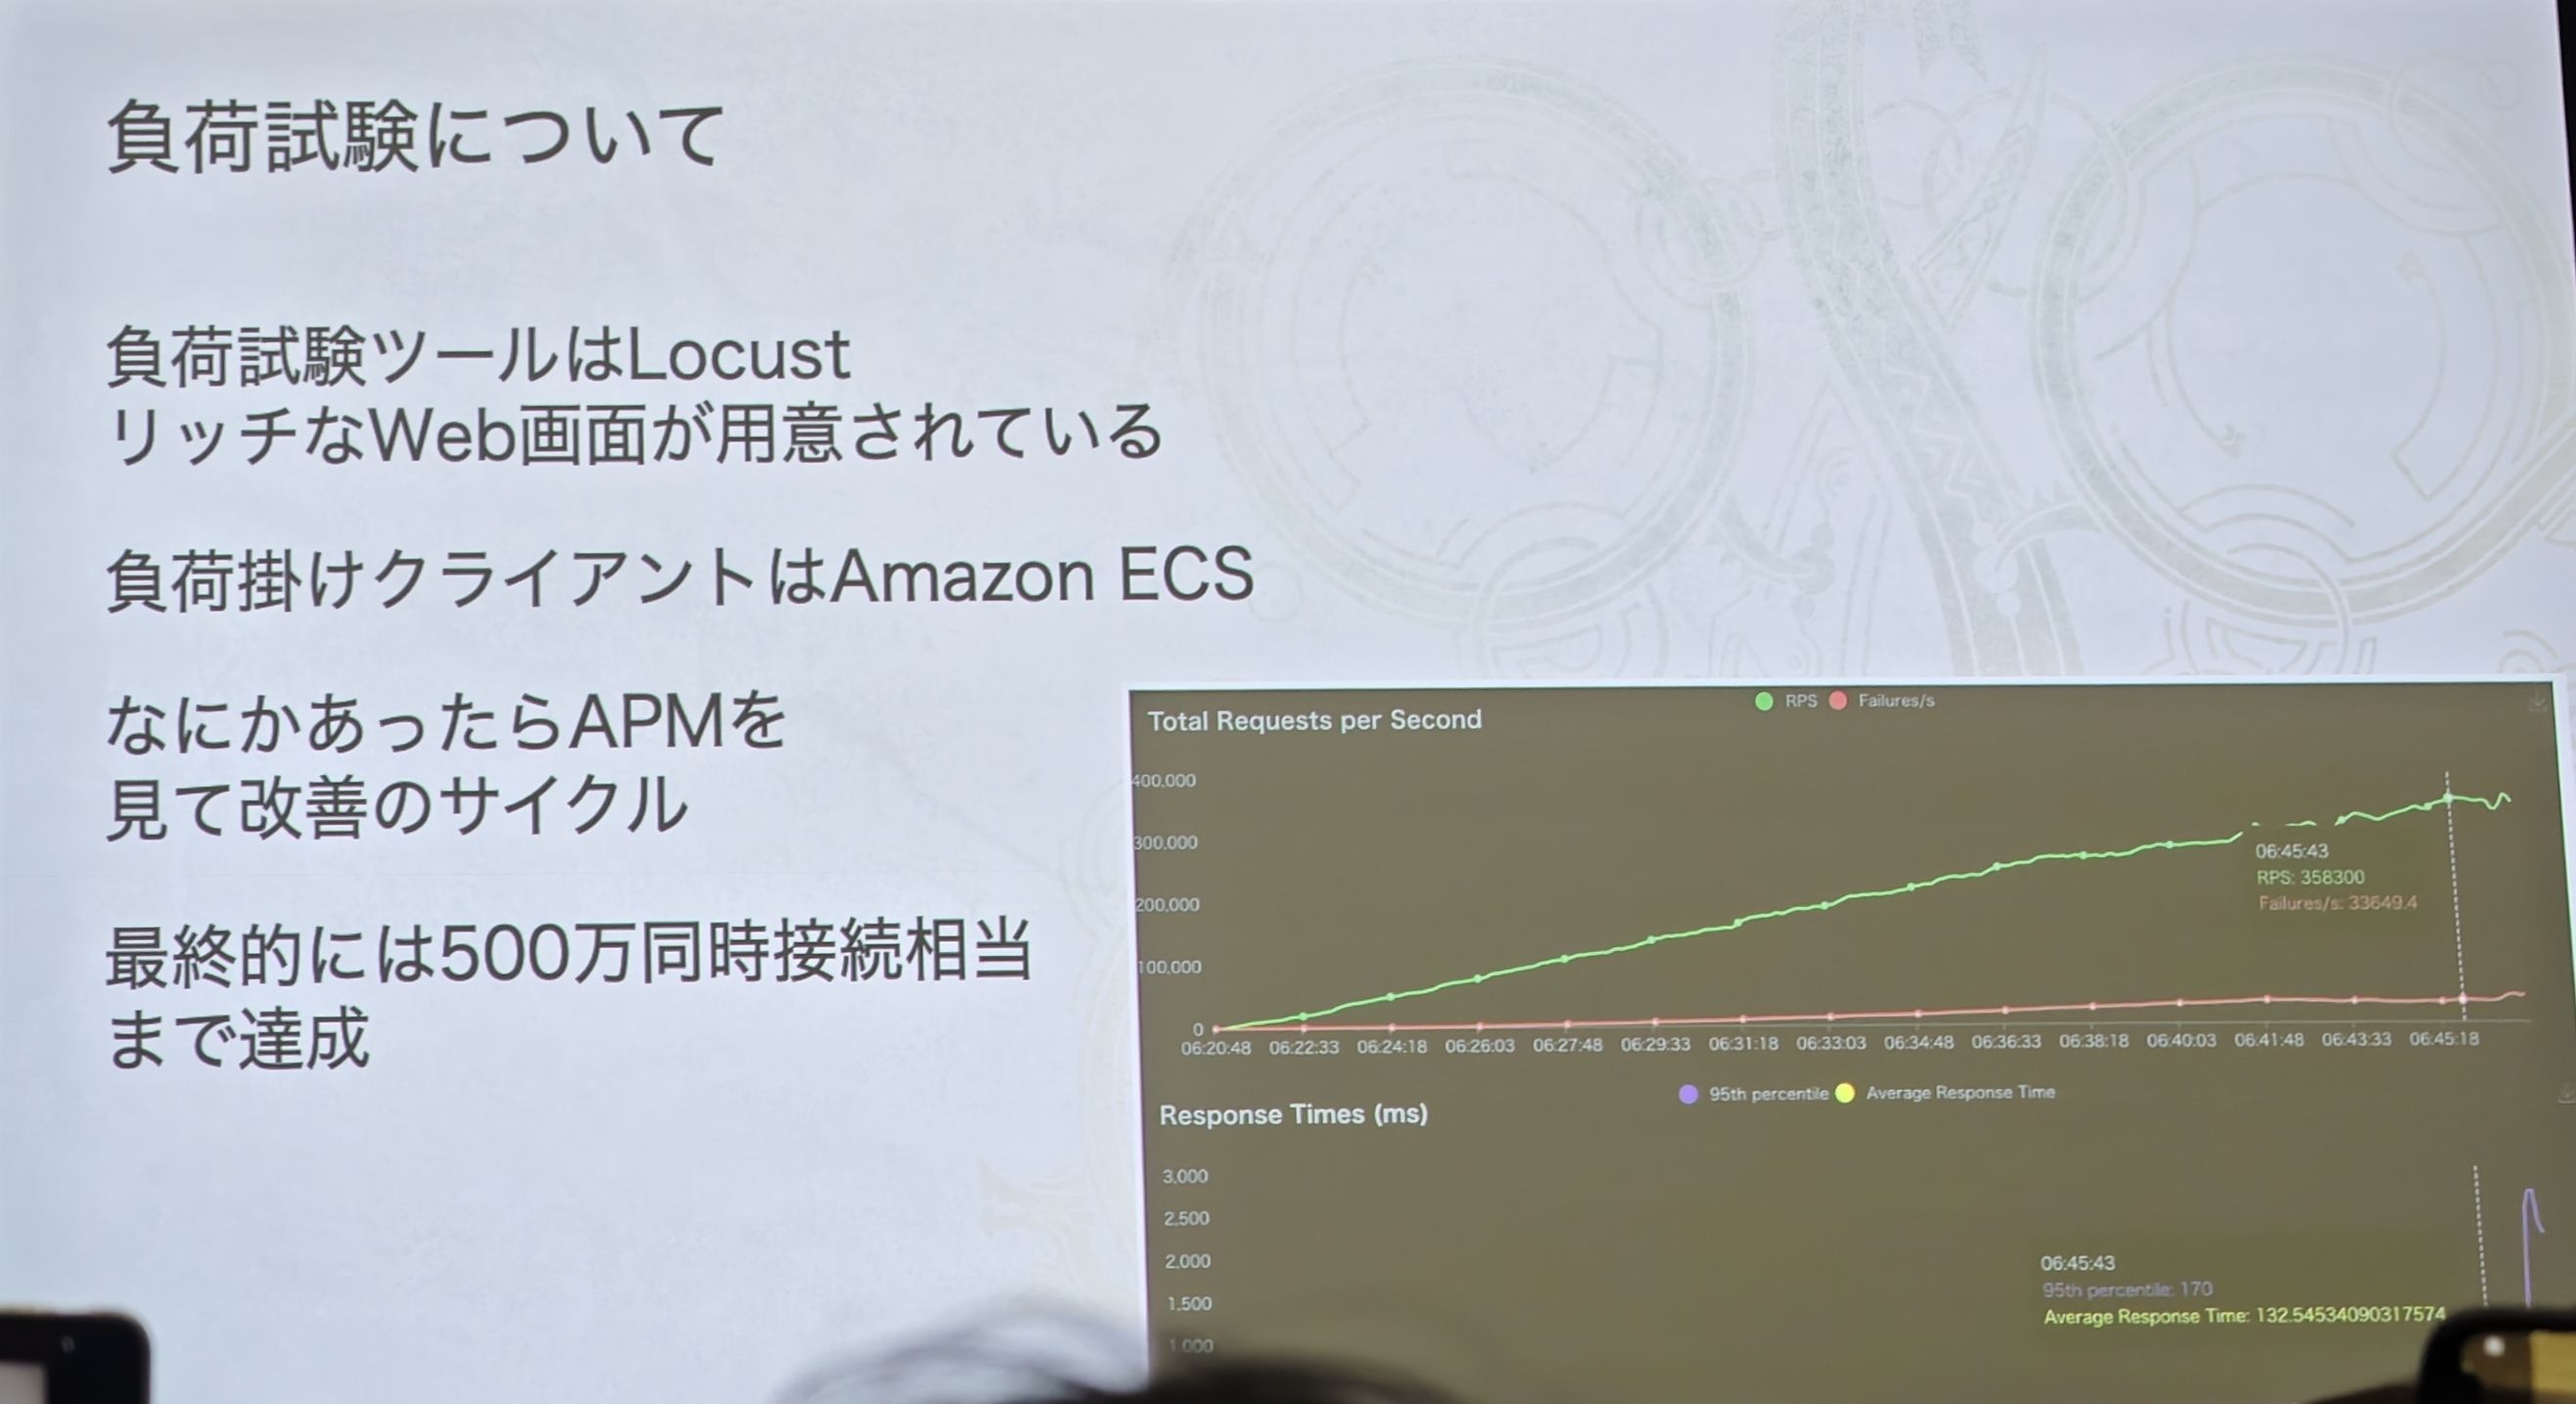
- Testing Methodology:
- Tooling: Locust, favored for its flexible web UI and Python test definitions.
- Load Generators: Running on Amazon ECS, leveraging Graviton processors and Spot instances to slash load-testing costs.
- Optimization Loop: The slides defined an iterative feedback loop: “Find bottlenecks through load testing -> Inspect APM traces -> Optimize and re-test.”
- Final Result: The green curve steadily climbed to an astonishing metric: “500 万同時接続相当まで達成” (Achieved equivalent of 5 million concurrent connections). This figure is the ultimate validation of their entire architecture—from microservices and service mesh to real-time servers and hybrid databases.
Launch Success Partner: AWS Countdown Premium
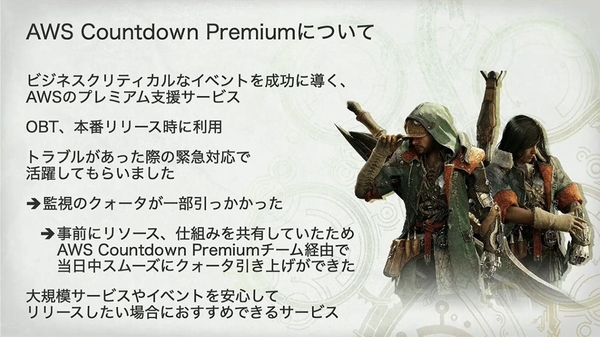
- Key Role: Provided critical emergency escalation support during open betas and launch milestones.
- Real-World Incident: The slide cited a concrete example: “監視のクォータが一部引っかかった” (Hit a quota ceiling on a monitoring service). In the middle of launch traffic, this could have been fatal.
- Resolution: Because the team had shared architectural designs and capacity forecasts with the AWS Countdown team ahead of time, AWS was able to increase service quotas smoothly on the same day. This highlighted the immense value of proactive planning during ultra-large-scale events.
- To be fair, this section felt a bit like a sponsor pitch—kudos to AWS for hosting, haha.
Retrospective
- The greatest recurring challenge remained AWS service quotas, re-emphasizing the necessity of Countdown support.
- The most difficult engineering feat was the SOS Flare matchmaking search.
- To keep the tech stack uniform with the real-time servers (EKS), they initially selected Amazon EKS on Fargate for the API layer.
- Regret: Amazon ECS would have been more cost-effective. ECS offered better flexibility with Spot instances and Graviton processors—two key levers for cost reduction that faced constraints on EKS Fargate at the time.
The Team
- Language: The team standardized entirely on Go.
- Team Size: Just 8 engineers! A lean team of eight engineered and operated a backend sustaining millions of concurrent players. It’s an incredible achievement that demonstrates the force-multiplying power of cloud-native managed services and modern tooling on developer productivity.
- Workflow: “基本的には横断で対応” (Fundamentally cross-functional collaboration), indicating a tightly knit, agile team.
Q&A Discussion
In my experience, self-hosting Prometheus isn’t overly difficult—in fact, I find it one of the more straightforward pieces of the Kubernetes ecosystem. I’ve even customized kube-state-metrics to expose custom cluster metrics.
You are completely right: for small-to-medium Kubernetes clusters or large clusters with relatively uniform workloads, self-hosting Prometheus via tools like the Prometheus Operator is a mature and manageable path. For a senior engineer capable of customizing kube-state-metrics, that complexity is easily controlled.
However, Capcom’s characterization of Prometheus as “painful” and “memory-hungry” must be viewed through the lens of their unprecedented scale and dynamic environment:
a) Orders of magnitude in scale:
The presentation noted that at peak, production ran approximately 300,000 Pods. Combine 300,000 Pods with tens of thousands of dynamically provisioned Karpenter nodes, EKS control planes, network interfaces, and storage—the resulting volume of time series is staggering.
When time-series cardinality reaches tens or hundreds of millions, Prometheus memory consumption explodes beyond what any single instance can bear. Self-hosting at that scale mandates federated architectures like Thanos, Cortex, or Mimir for sharding and long-term storage. Operating an HA Thanos deployment with store gateways, compactors, and queriers introduces operational overhead that dwarfs single-instance Prometheus.
b) Extreme business dynamism:
Game server fleets are volatile. Karpenter continuously spins up and tears down hundreds of nodes and Pods based on active player lobbies. This constant churn hammers service discovery, scraper loops, and churns out short-lived time series that exacerbate high-cardinality pressure.
c) Focusing team bandwidth:
The core backend team consisted of just 8 engineers responsible for development, feature iteration, deployment, and on-call response. Investing engineering hours into running a massive, high-availability monitoring cluster makes far less sense than purchasing a fully managed service backed by enterprise SLAs. Here, “painful” referred to long-term operational risk at scale, not initial installation.
When detecting that instances in the primary region were sold out, the system automatically fell back to create servers in
us-east-1.Is that actually fine? Wouldn’t players be furious about the network latency?
You hit on a critical point: routing Japanese players’ real-time combat sessions from Tokyo (ap-northeast-1) to US East (us-east-1) with over 150ms of physical latency would indeed provoke immense player frustration.
The key to understanding this mechanism lies in “who it migrates” and “when it triggers.”
a) It was never intended for local Japanese players:
This failover mechanism was almost certainly not routing Tokyo players to Virginia. Remember, their real-time servers are globally distributed to serve players across multiple continents.
A far more plausible scenario:
Suppose C7g inventory in Europe (eu-central-1) was exhausted due to a surge of European players. For a player in Europe, the matchmaker faces several alternatives:
- Outright failure: Inform the player room creation failed (worst experience).
- Extreme latency match: Route them to Tokyo (>200ms latency).
- Sub-optimal match: Provision their lobby in US East (
us-east-1).
Latency from Europe to US East is elevated (around 80–100ms), but vastly superior to Tokyo, and remains playable for a cooperative PvE game. A playable game with slightly elevated ping is vastly preferable to being locked out entirely.
b) Graceful degradation rather than normal operation:
This fallback acts as a safety valve triggered only under extreme capacity shortages. Its primary mission is preserving Availability—ensuring players can always create a room. During peak launch floods, maintaining availability overrides latency perfection.
c) Matchmaker intelligence:
The matchmaking service prioritizes the nearest physical region with lowest latency. Only when primary and secondary adjacent regions are depleted does it leverage cross-continental failovers. A player in Tokyo would always prioritize ap-northeast-1, then potentially Seoul (ap-northeast-2), and would never jump across the Pacific while Asian capacity existed.
 Hi, I’m CheerChen.