
Background
It has been about a year since I used Gemini to troubleshoot a freezing issue on Windows. Over the past year, I’ve maintained my habit of casting a skeptical eye on software produced by tech giants. Recently, I ran into another annoying issue on macOS. After debugging with an AI agent and cross-referencing developer forums, I confirmed it’s an XPC transaction memory leak in CursorUIViewService on Apple Silicon, introduced back in macOS Sonoma.
I rarely shut down my MacBook for work (who actually shuts down their MacBook?). Opening Activity Monitor one day, I spotted a process named CursorUIViewService flagged as “Not Responding,” eating 3.94 GB of memory—what on earth could consume that much RAM?
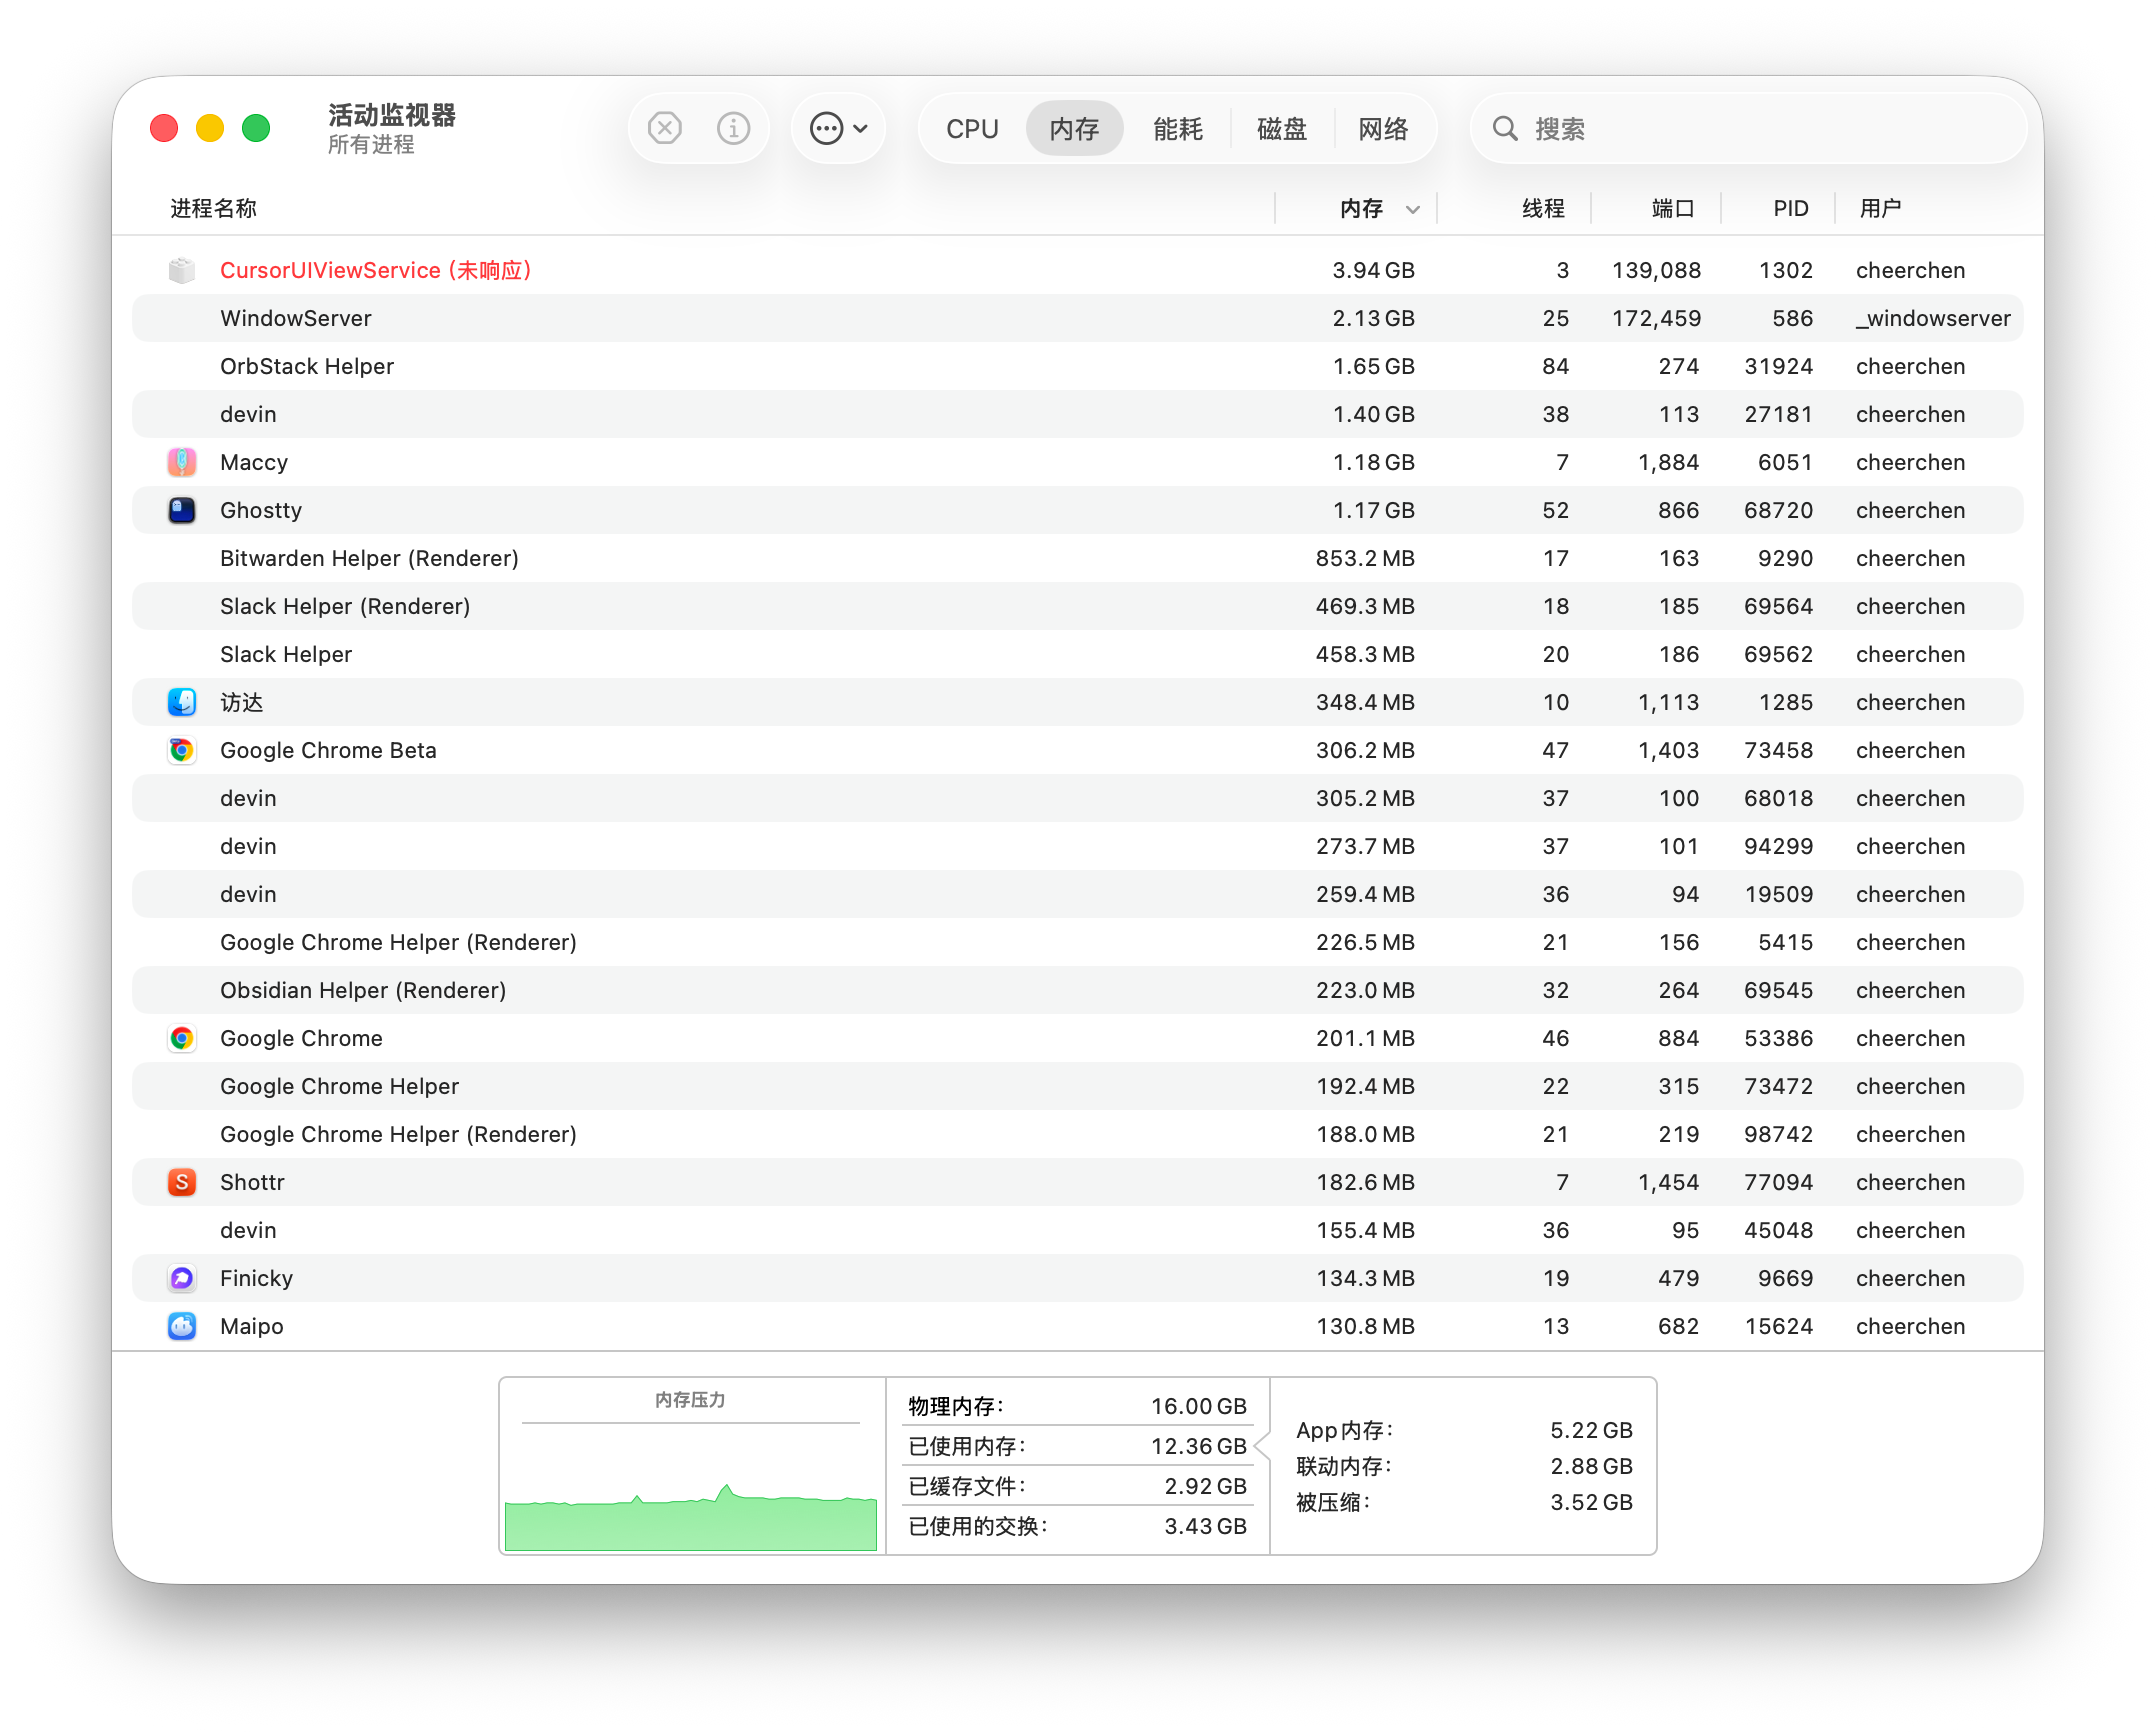
Activity Monitor showing CursorUIViewService memory steadily climbing (2.0 GB after 21 days, 3.94 GB after 30 days)
The most insidious part is that macOS memory management is almost too good and seamless. When physical memory runs tight, the kernel compresses memory, reclaims inactive pages, and swaps pages out to the SSD. Without running an uptime of many consecutive days, you might never notice this unresponsive process. In fact, without a line of red text in Activity Monitor, my dashboard almost felt incomplete.
Once again, that familiar itch returned: “I need to know what it is actually choking on. I can’t accept that the whole world is turning into a poorly staged amateur theater.”
So I summoned my new acquaintance, GLM 5.2, to dig into it.
Sifting through system logs and Apple Developer Forums, it confirmed this was a system bug introduced in macOS Sonoma that remains unfixed from Sequoia through Tahoe. Apple engineers on the Developer Forums have already acknowledged that it affects Apple Silicon.
TL;DR
If you suspect you’re affected, check CursorUIViewService in Activity Monitor first:
- Is the memory consumption of
CursorUIViewabnormally high? - Do system logs show a
hiserviceswatchdog entry every single second?
1log show --last 5m --predicate 'process == "CursorUIViewService"' \
2  | grep "why is this taking so long" | head
Diagnostic criteria:
| Inspection | Symptom |
|---|---|
| CursorUIView | Noticeably >500 MB (normal is ~30 MB), marked as “Not Responding” |
| System Logs | Timestamp occurs strictly once per second, all on the same thread ID |
If both match, choose one of the solutions below:
Option 1: Temporary Force Kill (Emergency Workaround)
1# Standard kill is ineffective as the process refuses to terminate; SIGKILL is required
2sudo kill -9 $(pgrep CursorUIView)- Risk: Reports on Apple forums suggest killing an active instance can occasionally freeze the UI and force a kernel panic/reboot. Save your work before executing.
launchd will automatically spawn a fresh instance the next time text input is needed, dropping memory back down to ~30 MB.
Option 2: Disable Redesigned Text Cursor (Recommended Permanent Fix)
Open Terminal and run:
1sudo defaults write /Library/Preferences/FeatureFlags/Domain/UIKit.plist \
2  redesigned_text_cursor -dict-add Enabled -bool NO
Restart your Mac for the change to take effect.
Trade-offs: The subtle arrow animation on the Caps Lock indicator is disabled, though the actual functionality of the Caps Lock key (toggling uppercase) remains completely unaffected. Input source indicator bubbles will revert to the classic pre-Sonoma appearance. For daily use, the difference is negligible.
Note: Major macOS updates or patches touching UIKit may reset this feature flag. Simply re-run the command if that happens.
A crucial technical distinction: this command does not deregister CursorUIViewService from the system—launchd will still spawn it as needed. What it changes is its runtime behavior: the service stops leaking XPC transactions, avoids runloop timeouts, and idle-exits cleanly as intended. Seeing this process appear briefly in ps output after the fix is completely normal.
That resolves the problem. The rest of this post is for those curious about the underlying mechanics—why this bug manifests as a livelock rather than a deadlock.
Root Cause Analysis
What Is CursorUIViewService and Why Does It Exist?
CursorUIViewService is an out-of-process text cursor UI rendering service introduced in macOS Sonoma (14). (It renders Caps Lock badges and input source indicators.)
- Path:
1/System/Library/PrivateFrameworks/TextInputUIMacHelper.framework/Versions/A/XPCServices/CursorUIViewService.xpc- Managed as an on-demand XPC service by
launchd - Responsibility: Rendering Caps Lock indicators, language switcher arrows, and auxiliary UI around modern text cursors
- Designed to exit automatically when idle
Why Did Apple Split This into a Separate Process?
Prior to Sonoma, text cursors and Caps Lock indicators were rendered directly within the process of the foreground application via legacy AppKit code paths. Sonoma introduced the “redesigned text cursor,” featuring animated indicator bubbles and an iOS-like visual transition. Providing consistent cross-application visual elements required a single system owner, so it was decoupled into an on-demand XPC service orchestrated by launchd.
The design intent for XPC services is clean:
- Launch on demand:
launchdspawns the process only when a foreground app needs to render indicators. - Idle exit: Automatically terminates after an idle window to reclaim RAM.
- Crash isolation: A crash in this service does not bring down the host application.
The flaw lies squarely in the “idle exit” phase: it is designed to exit, but a bug prevents it from doing so.
A classic community quip puts it best:
“This service is the world’s most over-engineered capslock indicator, and if you toggle caps lock a lot, it loses its mind.”
Why Does Memory Monotonically Accumulate?
Every time you toggle Caps Lock or switch input methods, the client (typically the active text application) sends an XPC request to CursorUIViewService. The service runs a complete pipeline on its main thread.
Tracing actual system logs illustrates the sequence:
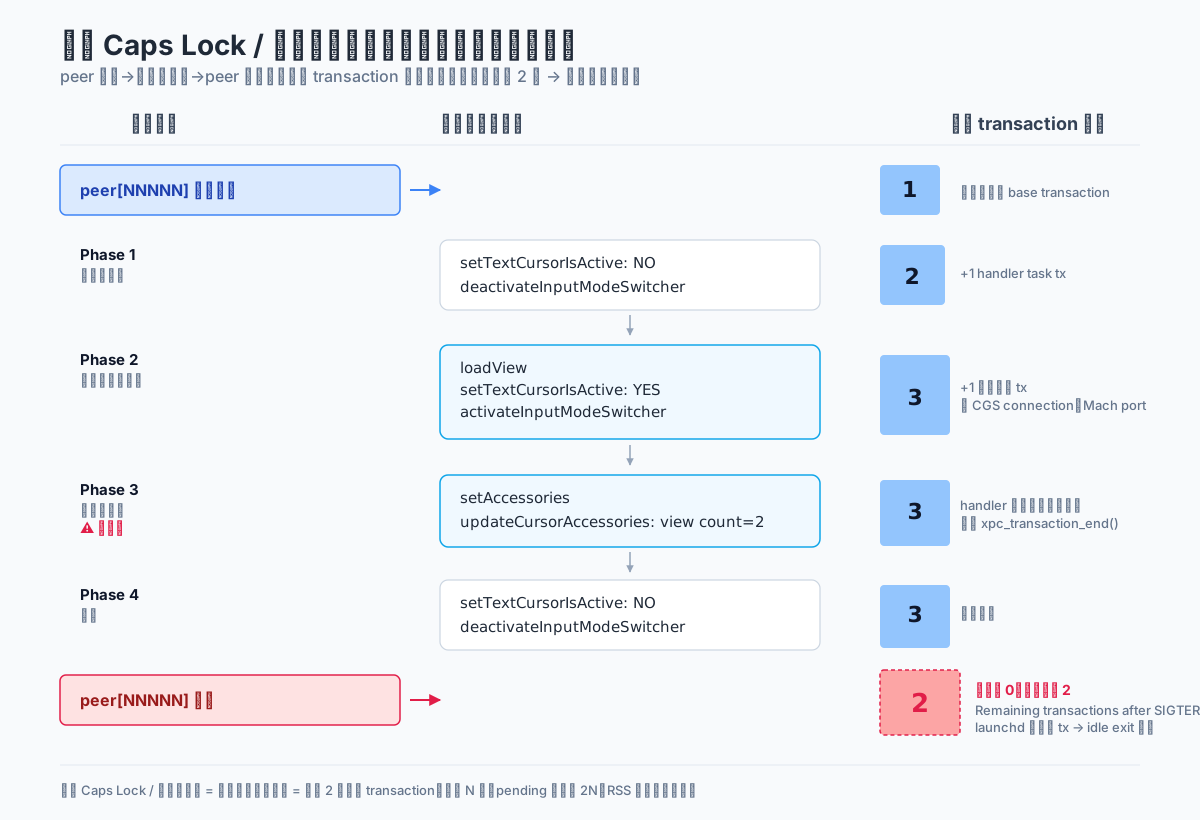
Call sequence and transaction count during a Caps Lock / IME switch: 2 leaked transactions remain when count should drop to zero
This pipeline engages multiple XPC transactions with SkyLight and WindowServer.
An XPC transaction is a reference-counting mechanism provided by libxpc. Service code uses xpc_transaction_begin() to signal “I am processing an uninterruptible task,” and calls xpc_transaction_end() when done to return the reference.
launchd inspects the active transaction count to determine whether an idle exit is permitted.
The bug is that certain transactions are never committed or aborted properly. Remaining transactions after SIGTERM: 2 in the logs is smoking-gun evidence: two active transactions remain even when commanded to terminate by a signal. The culpability rests on the server side (CursorUIViewService), which fails to balance begin/end across all code branches. While client disconnections should trigger cleanup, certain branches in server handlers omit returning references.
GLM gladly obliged with a simple three-panel analogy:
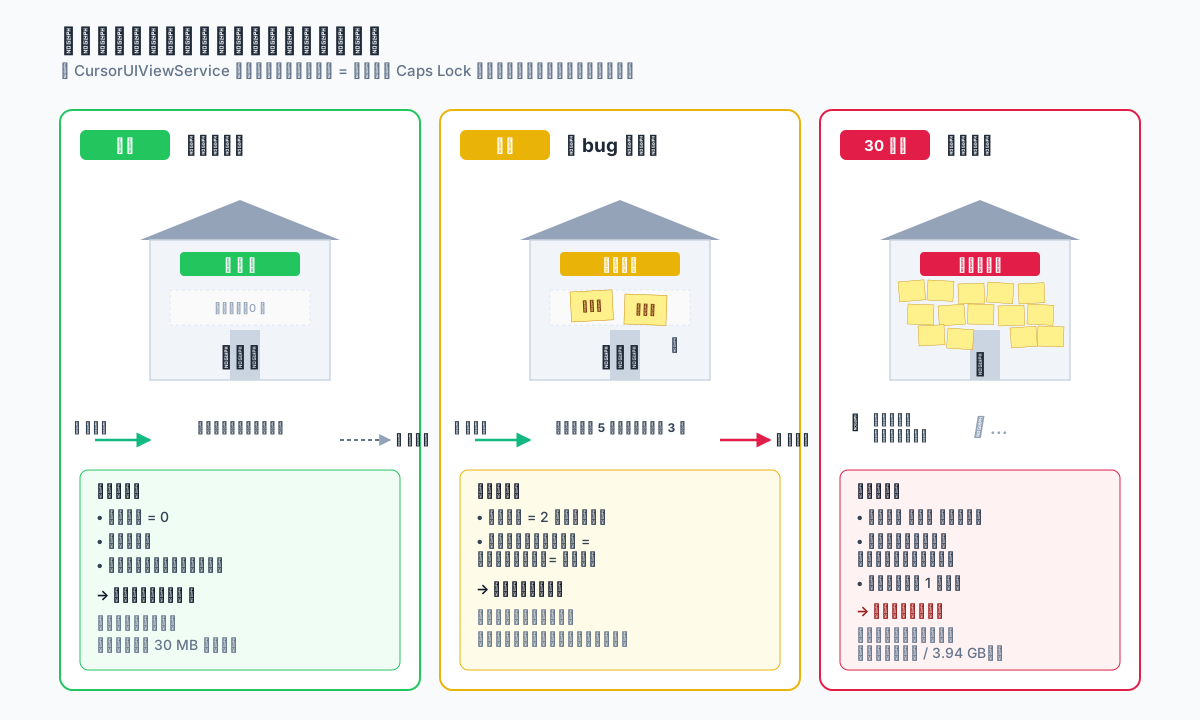
Convenience Store = CursorUIViewService process;
Customer = A single Caps Lock or input source toggle;
Sticky Note = XPC transaction;
Store Owner = launchd;
Closing Shop = Idle exit.
The accumulation chain works like this:
- Every toggle leaks a couple of XPC transactions (for every customer, the clerk forgets to tear down two sticky notes).
launchdchecks the transaction count before allowing an idle exit (the Owner’s rule: sticky notes on the wall = unfinished business = cannot close shop).- The process is forced to remain resident, while the pending queue grows monotonically with every toggle (the store can never close; sticky notes keep piling up on the wall).
- On every runloop turn, the main thread must process an ever-lengthening queue (before serving each new customer, the clerk must comb through the entire wall of notes—getting slower and slower, turning milliseconds into full seconds).
- Associated resources accumulate alongside pending items → RSS climbs from 30 MB up to hundreds of MB or multiple GBs (behind each sticky note sits an ingredient list, invoice copy, and vendor receipt, taking up mounting space).
- Memory growth is monotonically irreversible—there is no garbage-collection path, leaving
SIGKILLas the only reset (the owner must tear down the entire storefront and rebuild it from scratch, wiping the wall clean).
What Does why is this taking so long? Mean?
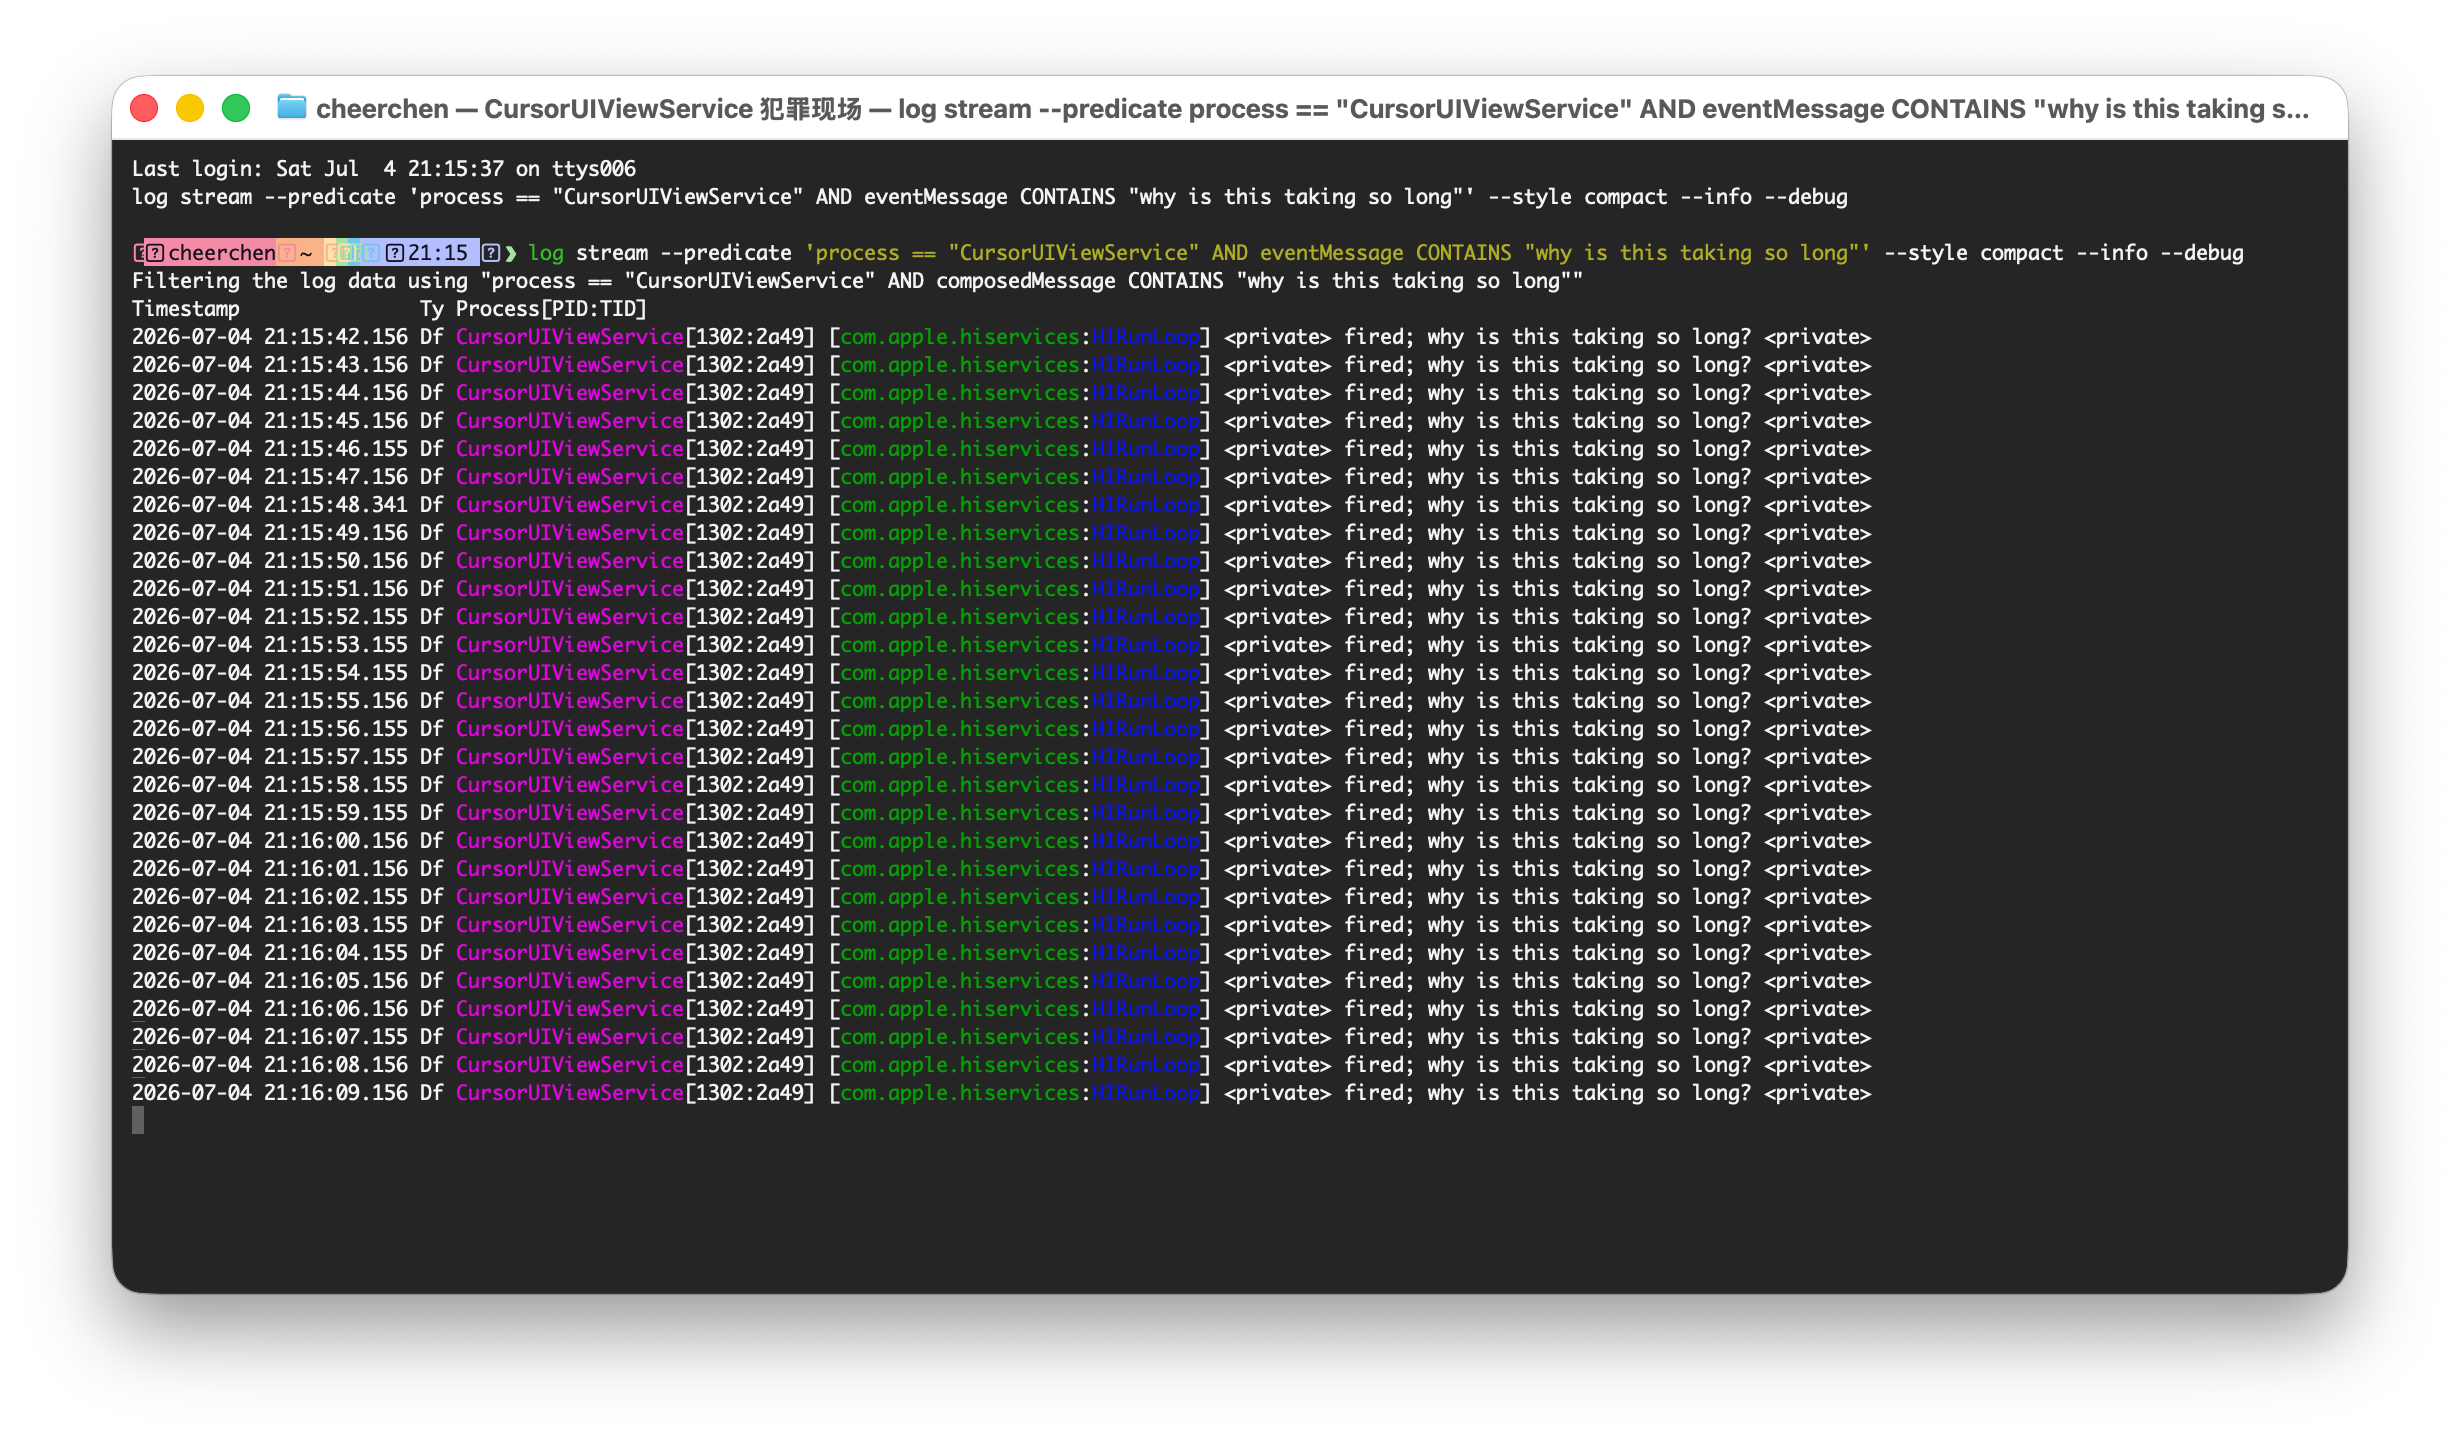
hiservices watchdog captured in log stream: complaining once per second on the same main thread
During a freeze, the most puzzling log line states:
1[com.apple.hiservices:HIRunLoop] fired; why is this taking so long?This log originates from com.apple.hiservices—a component of HIToolbox (Human Interface Toolbox).
The HIServices runloop contains an internal watchdog timer that ticks once per second. Every second, it verifies whether the current runloop turn is still active; if the previous iteration has not concluded, it prints a complaint. It does not terminate the process or restart the loop—it simply logs. It exists as an observability probe for Apple engineers.
Key characteristics confirm this:
- Timestamps occur strictly once per second—characteristic of a periodic timer.
- All logs originate from the identical thread (the main thread)—this is not concurrency contention, but a bogged-down main thread.
- Traces show the main thread spending time inside
nextEventMatchingMask:—the main thread is not deadlocked; it is still executing, but each iteration takes >1s.
In short: the main thread is caught in a slow crawl. Every second the watchdog wakes up, notices the previous turn hasn’t finished, and logs another complaint.
Why Does Activity Monitor Flag CursorUIViewService as “Not Responding”?
Activity Monitor marks an application as “Not Responding” when its main thread fails to acknowledge event pings from WindowServer over an extended duration.
WindowServer periodically dispatches an event tap ping to every UI process it oversees (community estimates suggest an ~8-second threshold, though Apple has not published an exact figure). The process must pop this event on its main thread and acknowledge it. In this case:
- The main thread is still executing (not deadlocked), but each iteration of
nextEventMatchingMask:→ event processing → rendering takes >1s. - WindowServer’s event ping sits queued behind an accumulation of backlogged transactions.
- As the backlog lengthens, response latency eclipses the ping threshold → flagged as “Not Responding.”
- Keyboard inputs and Caps Lock indicators experience lag in tandem, yet don’t freeze permanently—because the main thread continues running and occasionally catches up with the backlog, briefly restoring responsiveness.
This is not a frozen deadlock, but an active livelock: the main thread works continuously yet can never catch up to its queue, prompting the watchdog to complain every second.
Why Is kill -9 Mandatory?
launchd relies on active transaction counts to coordinate graceful exits. The default path when SIGTERM initiates a graceful shutdown:
launchdor the user sendsSIGTERM.- The process catches the signal and invokes cleanup routines (
atexit, AppKit’sapplicationWillTerminate:). libxpcinspects active transactions; if non-zero, it defers exit to allow in-flight transactions to conclude.- If transactions drop to zero within
ExitTimeOut(defaulting to ~20 seconds in launchd plists), the process exits normally. - If it times out,
launchdshould issue a fallbackSIGKILL.
The hitch here is that step 4 is unreachable—leaked transactions have no code path to return their reference counts. In theory, step 5 should intervene, but in practice, logs repeatedly print Remaining transactions after SIGTERM: 2 for dozens of seconds or indefinitely without launchd issuing a fallback SIGKILL. Probable causes: ExitTimeOut in CursorUIViewService’s job plist may be excessively long or undefined, or launchd handles standalone XPC services differently based on combinations of RunAtLoad, ThrottleInterval, and ProcessType.
This is why kill -9 (SIGKILL) is strictly necessary over plain kill.
Who Is Most Susceptible?
Users with Long Uptime Who Sleep via Clamshell Rather than Shutting Down
A subtle clue in system logs and spindump reads:
1turnstile waiting for WindowServerTurnstile is Apple’s internal priority-inversion lock debugging infrastructure (documented in Darwin open-source headers). Seeing this indicates CursorUIViewService is blocking on a response from WindowServer.
When a Mac wakes from sleep, the graphics stack renegotiates state: WindowServer rebuilds compositing contexts, services request fresh CGS connections, and Mach ports re-handshake. Normally, this renegotiation is idempotent and takes tens of milliseconds.
However, CursorUIViewService has buggy reconnection logic on wake: prior CGS connections may have invalidated, yet the service attempts to dispatch messages via stale handles. When these calls time out, handles are not released and immediately enqueue the next turn, flooding the pending queue with “zombie transactions.”
Consequently, for users who avoid restarting and rely on clamshell sleep (like myself), this bug is essentially guaranteed to manifest over time.
Multilingual and CJK Users
Monolingual English users rarely hit this issue: they do not switch input sources and might toggle Caps Lock only a handful of times per day. The service has ample time to idle-exit cleanly long before leaks can accumulate.
Users of Chinese, Japanese, or Korean face a starkly different reality:
- Input switching (English ↔ Chinese, Traditional ↔ Simplified, Kana ↔ Kanji) occurs multiple times per minute.
- Every switch traverses the full
deactivateInputModeSwitcher→activateInputModeSwitcherlifecycle. - Every lifecycle invocation is an opportunity to leak XPC transactions.
- Toggling via Ctrl+Space, Caps Lock, or Shift routes through different handler branches, each carrying distinct leak probabilities.
Combine that with Apple Silicon, multi-week uptimes (I frequently run 30+ days), and frequent sleep/wake cycles—hitting all four conditions makes your machine the ideal host for this bug.
InputSourcePro Users
Utilities that automatically switch input sources based on the active application (such as InputSourcePro) dramatically amplify this behavior.
These tools turn every app switch and browser tab transition into an input method toggle, inflating daily switch counts by orders of magnitude compared to manual usage.
Reviewing its source code confirms two things:
- Switching invokes Carbon HIToolbox’s
TISSelectInputSource—the identical system path used by menu-bar switching and Caps Lock toggling.CursorUIViewServiceis notified and leaks transactions all the same. - For CJKV input sources, to circumvent a macOS bug where input sources switch incompletely, the utility may fire 2 to 4 sequential
TISSelectInputSourcecalls per transition (thetemporaryInputWindowstrategy calls it twice;previousInputSourceShortcutcalls it up to four times). Every call introduces a leak opportunity.
In other words, the leak rate for an InputSourcePro user can be several times higher than manual switching. The author evidently ran into this firsthand: the app’s General settings tab includes a built-in toggle called “Cursor Lag Fix,” which runs the exact same defaults command described in Option 2 above.
If you use InputSourcePro, enabling that toggle directly in settings saves you from having to run the terminal command manually.
Community Timeline
- 2023 Q4, macOS Sonoma 14.0: Redesigned text cursor debuts;
CursorUIViewServiceappears for the first time. Sporadic reports surface on Apple Developer Forums throughout Sonoma 14.1 and 14.2, largely misattributed to third-party input method plugins. - First Half of 2024, around Sonoma 14.4: Explicit technical threads appear on Apple Developer Forums with spindumps and sampling logs. An Apple engineer acknowledges in a reply that they are “aware of the issue, tracking internally.”
- 2024 Q3, macOS Sequoia 15.0: Internal IME code paths receive adjustments, easing symptoms for some users, but the underlying XPC transaction leak remains reproducible.
- 2025, Sequoia 15.x series: Multiple point releases ship without touching this code path.
- 2026, macOS Tahoe 26.x: As of this writing (26.5.1), the bug persists. I reproduced it consistently across three different machines running Tahoe.
Tracking Apple Radar or openradar reveals related tickets, though rarely with an ETA.
Given the release cadence of macOS and the architectural shifts around UIKit since Sonoma, an upstream fix before later Tahoe updates seems unlikely. Rather than filing another radar report, I will simply disable the redesigned_text_cursor flag out of the box on every Apple Silicon MacBook I set up going forward.
 Hi, I’m CheerChen.